 By Ben Deakin, Chief Customer Officer.
Takt Time
We were recently visiting a manufacturing facility that produces electric buses.
They have an excellent production manager who always wanted to know, in his words, “Are we ahead or behind?”
This phrase brilliantly sums up a big part of what teams in manufacturing really want to know at any time.
In other words, are we producing at a rate to satisfy customer demand?
What is Takt Time?
Enter the well-used phrase “Takt Time”. In German, the word Takt literally means the beat or rhythm usually associated with music.
“Takt” has now been borrowed by Manufacturing across the world and now means: “The speed that a product needs to be produced to meet customer demand.”
A fictional example at a bus factory:
The amount of customer orders requires 5 buses to be produced a week and the bus factory is producing at 40 hours a week.
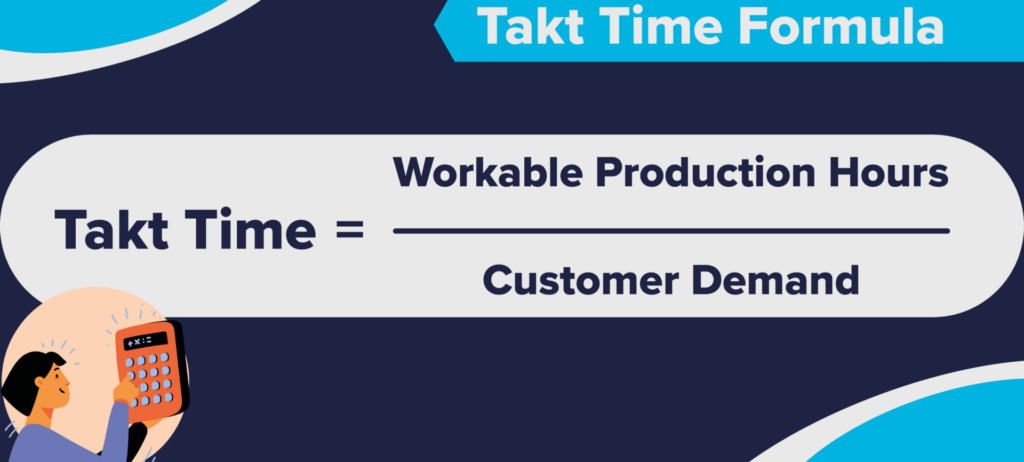
The Takt Time Formula is as simple as:

So, for the bus example, we know that customers want 5 buses to be made a week. So that is our customer demand.
As we know demand over a week period, then we need to know how many workable hours we have in a week, which is 40 hours.
Takt Time formula with bus example:

This means we need to produce a bus every 8 hours to satisfy customer demand.
Helpful Quote:
Time waste differs from material waste in that there can be no salvage. The easiest of all wastes and the hardest to correct is the waste of time, because wasted time does not litter the floor like wasted material.
Henry Ford
Try out our handy Takt Time Calculator below:
More to follow in the next section…
Cycle Time
What is Cycle Time?
Cycle Time, often confused with Takt Time is, “The speed at which a product is truly produced”.
So, let’s say that the factory is only producing 2 buses a week due to part shortages.
Our Takt Time remains the same as it was. The customers still want 5 a week and we are still working at 40 hours a week. But how long did we truly take to make a bus?
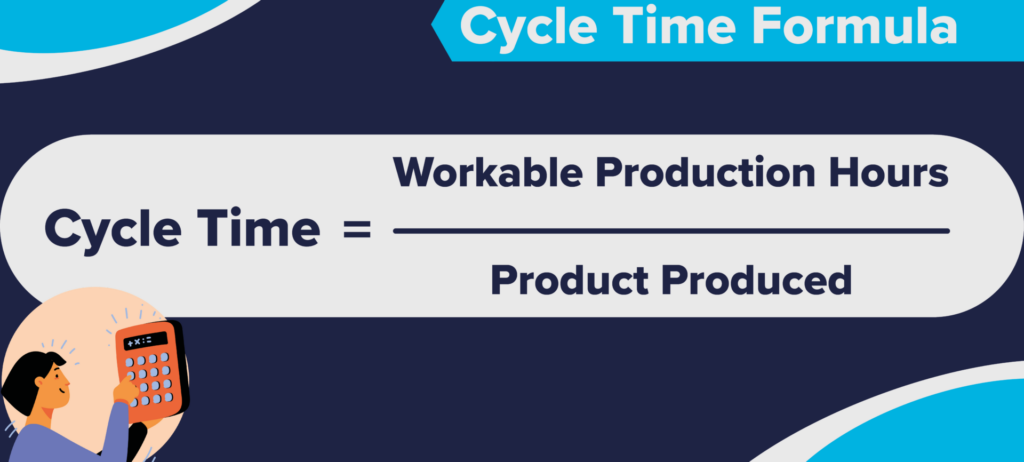
The Cycle Time formula is as below:

We know that we are only making 2 buses a week.
The amount of time we have remains the same. We still have 40 hours.
Cycle Time formula with bus example:

It took 20 hours to build a bus which is the outcome of the Cycle Time formula.
The Takt Time, though, is 8 hours. So, we are currently far away from what we need to achieve to satisfy demand.
Try out our handy Cycle Time Calculator below:
Takt Time vs Cycle Time
Takt Time vs Cycle Time
If the bus only took 4 hours to produce (meaning our Cycle Time is 4 hours) we would still want to change something otherwise we will have buses pilling up at the end of the line taking up space and adding waste…. customers only want 1 every 8 hours!
This is why aiming to have Takt Time = Cycle Time is the best and most Lean approach. In a perfect world, every minute spent on the shop-floor goes towards fulfilling the customer’s exact demand.
Cheat Sheet:
What is Takt Time? – The speed that a product needs to be produced to satisfy customer demand
What is Cycle Time? – The speed at which a product is truly produced

Shorter vs Longer Takt Time
In most high-volume automotive plants conveyor systems move bodies, painted bodies and assemblies around the factory. The speed of the conveyors drives the Takt.
If the operators can’t keep up with conveyor, then the line needs to be manually stopped… and that becomes obvious very quickly. So, in this type of manufacturing, the conveyor speed strongly binds the expectation of the customer directly to the people on the shopfloor.
However, many manufacturers in a High-Mix, Low-Volume (HMLV) environment produce products with no conveyors and much longer Takt Times. The longer the Takt Time, the harder it can become to ensure that shopfloor teams are working to the right pace.
The reasoning for this increased difficulty is quite human. There is no clear “here and now” target to work to and no indication of whether the shopfloor teams are currently “ahead or behind” so people tend to do their best, but without a clear idea of where they need to go. It is not a surprise that volumes can become sustainably hard to achieve.
This is where visualizing Takt Time remaining vs how far we are physically through the build becomes extremely powerful.
Benefits of Visual Takt Time vs Cycle Time
The level of improvement after introducing this visually, can be staggering. This is for the following reasons:
- Tying the shopfloor to customer demand: The team on the shopfloor can, at any time, understand if their work is ahead or behind the customer’s expectations. This then allows the team to immediately react if there are any deviations.
- Improved Production Planning: Visible Takt Time provides clarity on production requirements, enabling precise and effective production planning. This creates a positive ripple effect across a variety of manufacturing processes, such as: work balancing, material flow, production layouts and many other areas. Aligning production pace with customer demand minimizes waste and excess inventory, maximizing resource utilization and timely order fulfilment.
- An Empowered and Engaged Workforce: Visible Takt Time fosters employee engagement, providing a sense of purpose and urgency in meeting production goals. Employees become proactive in seeking efficiency improvements, fostering a culture of continuous improvement and collaboration.
- Improved First-Time-Quality: Visible Takt Time can be used to help balance processes. Nailing down your Takt Time (allowing for the required amount of quality actions and checks within the target time frame) encourages a ‘No Fault Forward’ mentality. Rushing activities or not having time to carry out checks often leads to errors and faults.
Leveraging NoMuda VisualFactory for Visible Takt Times and Cycle Times:
To achieve Visible Takt Time vs Cycle Time, cutting edge tools like NoMuda VisualFactory can be used. The MES software enables real time monitoring and display of Takt Time data on the shop-floor per workstation as well as displaying how far through the work the shopfloor truly is. This elegantly merges Takt Time and Cycle Time into one graphic.
With the previous example, if the Takt Time for a bus is 8 hours and we have 4 hours left then we would hope to be 50% the way through the build, if not, we need to react to catch up!
Presenting real-time Takt-Time vs “where we truly are” is a game-changing strategy for manufacturing companies aiming to optimize their processes and achieve higher efficiency levels. By aligning production pace with customer demand while utilizing advanced tools like NoMuda VisualFactory, companies position themselves for success in today’s ever-more competitive landscape.
Find out how VisualFactory can transform your process by getting in touch with a member of our customer support team today: info@nomuda.com

7 Wastes Of Lean Manufacturing
Introduction Muda is the Japanese word for waste, the inevitable and unwanted gremlin of every
Elevating Oil and Gas Equipment Manufacturing with NoMuda VisualFactory
Oil & Gas. In the competitive landscape of the oil and gas industry, the stakes
Have You Heard the News? NoMuda VisualFactory has been recognized as a 2023 Customers’ Choice
We at NoMuda are super-thrilled to be recognized as a Customers' Choice for September 2023


